SaaS Platform Dashboard
Created a premium web-based telemetry console utilizing real-time chart renderings, serverless API queries, and adaptive dark and light layout systems.
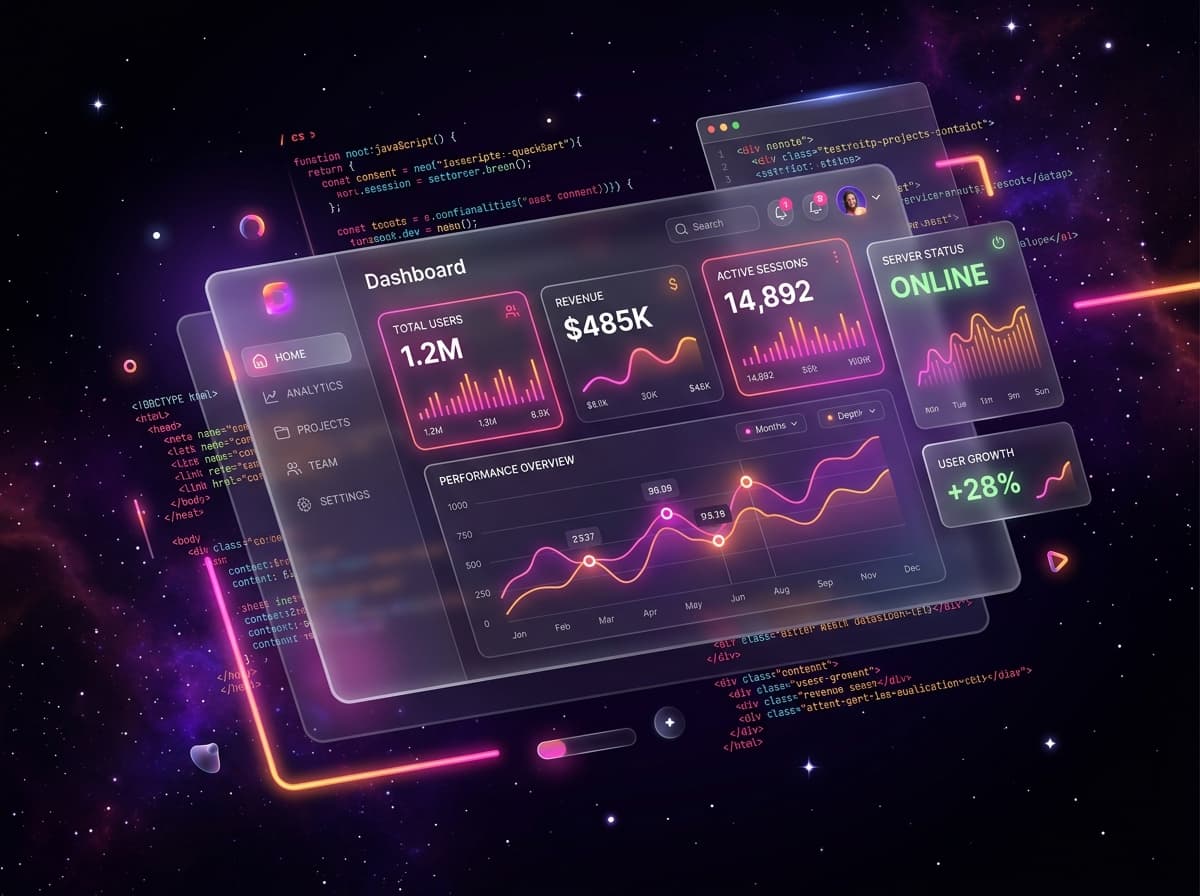
A SaaS client's telemetry console was built on a polling architecture that struggled to keep dashboards current under real customer load, and the interface itself hadn't kept pace with the product's growth — dense data views with no dark-mode option, on a stack the team found increasingly hard to extend. We rebuilt the console around a serverless API layer with real-time chart rendering, replacing periodic polling with push-based updates so the dashboard reflects what's actually happening as it happens. The new interface ships with adaptive dark and light layout systems and was built as a component library the client's own team could keep extending after handover. The rebuilt console renders live telemetry views in under 150ms, a responsiveness bar the previous polling-based version couldn't approach regardless of infrastructure scaling.